“I am tired of telling falsehoods to people about where they can and cannot buy; I am tired of selling old houses and of never being able to sell new houses to the people with whom I am identified.…Most of all, I am tired of supporting American prejudice that is rampant here in Rochester in this field.” –Howard W. Coles, Publisher of the Black newspaper, The Voice, and a licensed realtor
The Home Owners’ Loan Corporation (HOLC) created maps for 239 US cities and their surrounding metro-areas to assign “risk” for granting mortgages (a loan to purchase a house or fix up a property). These maps identified the racial, ethnic, and social classes of the people living in the area, as well as the characteristics of the housing, including age, repair, price. These descriptions and data were used to assign grades to neighborhoods.
The HOLC maps presented a white, elite perspective, resulting in the downgrading of Black neighborhoods, and reaffirmed efforts to make it difficult or impossible for residents in the Clarissa Street neighborhood, and elsewhere in Rochester, to access mortgage financing and to become homeowners.
At the same time, the Federal Housing Authority (FHA) was assisting white families with getting loans to buy homes in the newly developing suburbs.
Compare Rochester with areas outside the city. What do you notice?
What do you find if you look up areas where you have lived or are curious about? How do these patterns compare with today?
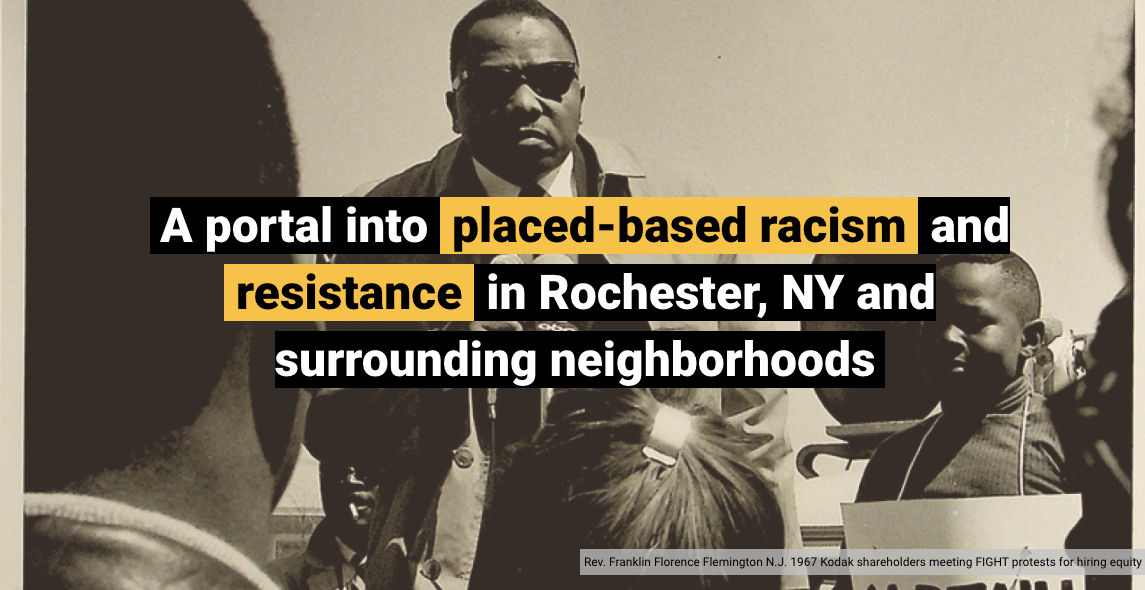
Courtesy of Resistance Mapping, a local collaborative digital humanities project on “place-based” racism and resistance in Monroe County, NY.
The Resistance Mapping platform is available online and supports the ongoing development of the K-12 Antiracist Curriculum Project. The interactive maps and curriculum aim to close the distance between history lessons and students’ everyday lived experience.
A Case Study of Perpetual Marginalization through Urban Planning, written by Brennon Thompson on Medium.com